Feb 11 2014. C. Stubbs
We intend to add a spectrograph to monitor emission spectrum of the sky. Assuming we mostly interested in surface brightness, the f-number of the spectrograph input determines the signal level. The focal length of the input optic determines the solid angle subtended by the spectrograph input.
It would be simplest if we pointed at the South celestial pole. Need to compute how much flux comes from point sources and how much from stars, as a function of distance away from the S celestial pole. I queried Simbad to find stars close the S pole that are brighter than 12th magnitude. That file is here: stars.dat
We can make a comparison of stellar fluxes to sky brightness without knowing the number of photons per sec associated with a certain magnitude. All that matters is the relative flux level between stars and sky. Nominal V band sky brightness is 20th mag per square arc second. Since fluxes are additive and magnitudes are not, We'll make this assessment in flux units.
Assign some surface brightness Phi_o per square arc sec to the sky brightness at 20th magnitude. In arbitrary units (zero point = 0) this corresponds to a surface brightness of
Sigma=10^{-20/2.5} = 1E-8 per square arc sec.
Converting this into a brightness per square degree we need to multiply by 3600*3600 to get 0.1296 flux units per square degree of sky brightness.
Now let's add up, as a function of increasing declination, the flux contribution from point sources that are brighter than 12th magnitude, as we move away from pole.
In these units each point source contributes a flux of 10^{-mag/2.5}. So a zeroth magnitude star contributes one unit of flux, in these relative units, and a fifth mag star give 1E-2.
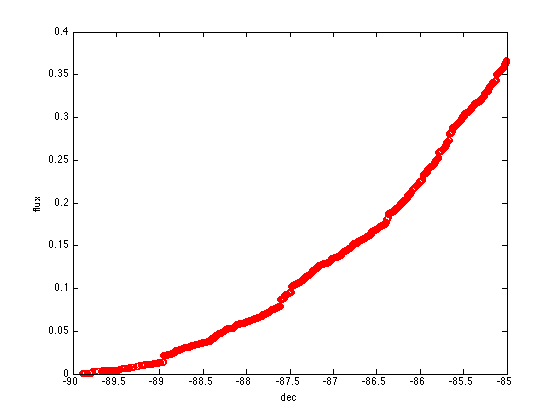
I sorted the data file in order of increasing declination, and made a plot of cumulative flux from point sources as a function of declination.
here is the resulting plot:

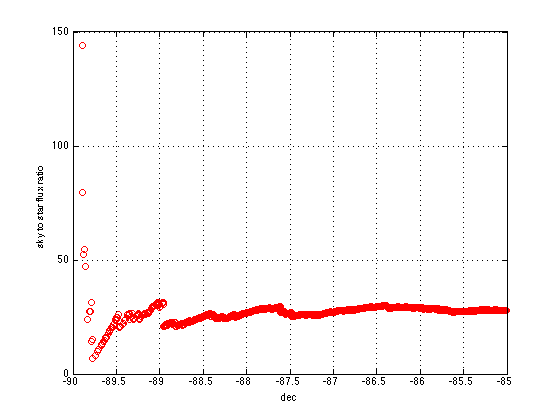
So in a diameter of 10 degrees centered on the S celestial pole, the flux sky brightness at V=20th mag per square arc sec totally dominates over the flux from point sources. In fact the ratio of the enclosed fluxes within this aperture is about 27. Contamination from starlight is a 4% correction to the sky brightness, down to 12th mag. Here's a plot of starlight component only:

So it's fairly gradual, and is not dominated by any specific bright stars.
Assume we want to drop 10 degree diameter onto a 600 micron optical fiber. What's the focal length? sin(theta) ~ theta=600E-6/f = 0.1745 so f=600E-6/0.1745 = 3.4 mm
How does the ratio of sky flux to integrated stellar flux depend on declination?

It looks like any field diameter greater than about 4 degrees is about the same.
So we're looking for an f/4 lens with a 4-5mm focal length. (Ocean Optics spectrograph is f/4).
Ocean Optics makes a 10mm focal length 74-ACR achromatic 10 mm focal length lens. That would produce a FOV diameter of D = 3.5 deg *(d/600 microns). So a 1000 micron
fiber would give us a field diameter of 5.6 degrees. That corresponds to going out to dec of -87.1 degrees radius in above plots.
1) So one configuration might be:
74-ACR Ocean Optics collimating lens focused at infinity, so that it images a 3.5 degree diameter field onto a 600 micron fiber diameter. Lens information here: Ocean_Optics_Sampling_Accessories.pdf
We need a fiber that transmits 350 nm to 950 nm.
2) Another option is to just point the optical fiber at the sky, limiting the input f-number to f/4 with a baffle. This would subtend an angle on the sky of 45 degrees. We could then trade off collecting area against spectral resolution just by picking different fiber sizes.
3) A third option is to use a Fabry lens, where the input pupil is imaged onto the optical fiber surface. See http://www.hposoft.com/IAPPP/PEPManual/ManualP6.html for an example of this.
A link to at least one example of Linux code for Ocean Optics is here, could likely be used with Raspberry Pi system:
https://code.google.com/p/linuxmeasurement/