The contents of this page have been relocated to DocuShare as DMTR-13.
Do not cite this confluence page.
| Table of Contents |
|---|
This page captures information about the large scale tests we ran on the IN2P3 cluster during Summer 2015.
For comparisons, here is a link to the previous large scale test that we run: https://dev.lsstcorp.org/trac/wiki/db/Qserv/in2p3_300
Data Set
| table | row count | .MYD size [TB] | .MYI size [TB] |
|---|---|---|---|
| Object | 1,889,695,615 | 2.45 | 0.06 |
| Source | 34,886,017,763 | 17.13 | 2.05 |
| ForcedSource | 172,081,115,270` | 5.85 | 4.61 |
...
Total MySQL data dir size: 33.2 TB
...
Data on 24 nodes (for comparison, DR1 is expected to be on 92 nodes).
Short queries
- single object selection by id: 0.09 sec
- small spatial area selection from Object: 0.33 sec
Full table scans, single query at a time
- Object ~4 min
- Source ~18 min
- ForcedSource ~15 min
Full table joins, single query at a time
- Object x Source: ~23 min
- Object x ForcedSource: ~ 21 min
Concurrent scans
- 2 Object scans ~ 8 min, 5 Object scans ~16-20 min (this shows that our shared scan code has issues, scheduled to be solved in W16)
Heavy load test 50 LV + 5 HV
- 50 low volume and 5 high volume queries (3 scans for Object, 1 scan for Source, 1 Object-Source joins), all running simultaneously with appropriate sleep in between queries to enforce the mix we were aiming
- During 24 hours we completed:
- 431,597 low volume queries (consistent with the baseline: ~10 sec per query, or 432,000 queries in 24h)
- 73 Object scans (consistent with baseline: ~1h per query, or 72 in 24h)
- 3 Source scans (consistent with baseline: ~8h per query, or 3 in 24h)
- 3 Object-Source joins (consistent with the baseline ~8h per query, or 3 in 24h)
- overall size of results was 6.5 GB (~16 KB per query on average)
- Average times:
- low volume queries: 0.91 sec (per baseline, should be under 10 sec)
- Object scan: 15 min (per baseline, should be under 1 hour)
- Source scan: 56 min (per baseline, should be under 8 hours)
- Object-Source join 57 min (per baseline, should be under 8 hours)
- Observations:
- io bound during the time when scans happen at the same time. Disks 85-90% busy (~750 MB/sec seen)
- the aggregate load on the cluster: https://confluence.lsstcorp.org/download/attachments/35815659/in2p3_5HV50LV.png?api=v2
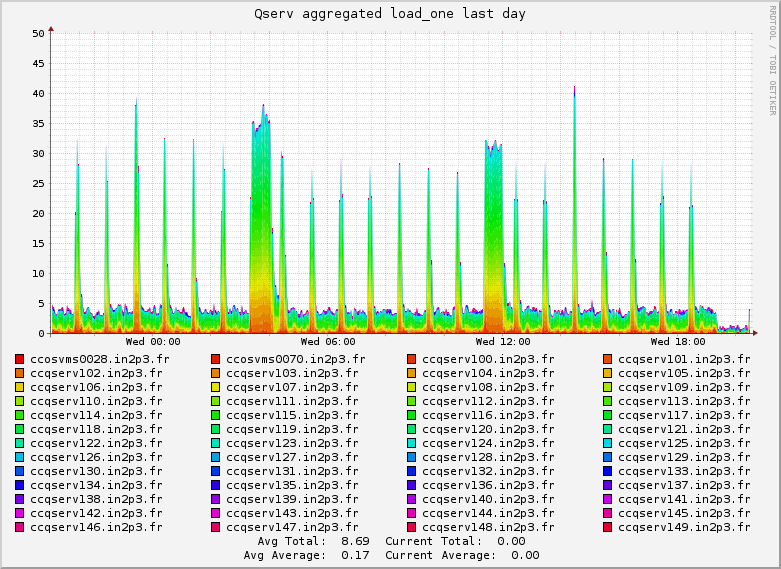
Heavy load test 100 LV + 10 HV
- 100 low volume and 10 high volume queries (6 scans for Object, 2 scan for Source, 2 Object-Source joins), all running simultaneously with appropriate sleep in between queries to enforce the mix we were aiming
- During 24 hours we completed:
- 861,608 low volume queries
- 144 Object scans
- 6 Source scans
- 8 Object-Source joins
- Average times:
- low volume queries: 5.1 sec
- Object scan: 22 min
- Source scan: 1 h 33 min
- Object-Source join 1 h 22 min
- Observations:
- the aggregate load on the cluster: https://confluence.lsstcorp.org/download/attachments/35815659/in2p3_10HV100LV.png?api=v2
- Notes: during the last part of that test we were reloading data on the node ccqserv101, which was impacted how the average load on the cluster looked like
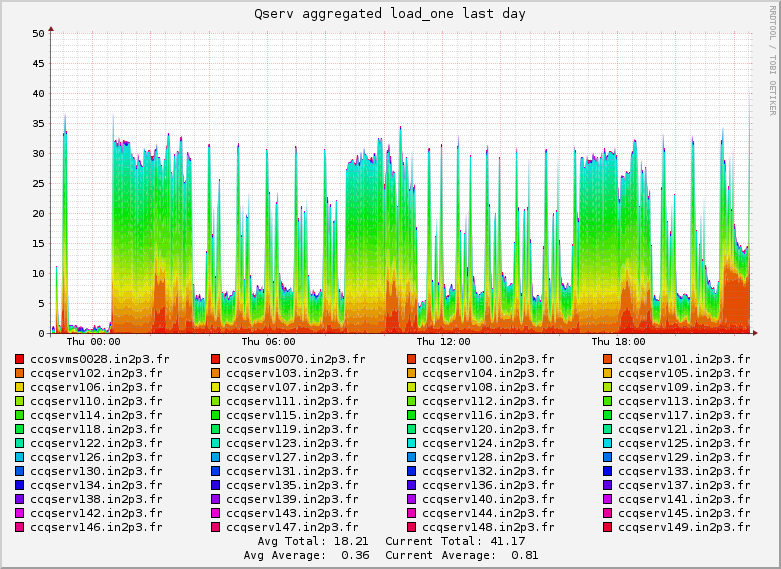
Notes and Observations
- Concurrently greatly improved. This was the very first time we ever successfully ran more than 3-4 simultaneous queries (we run up to 110).
- Robustness greatly improved. This was the very first time we ran continuously without any failure for 24 hours (it could have ran for longer, we just limited it to 24h)
- Latency reduced 100x. In previous tests average time to complete low-volume query was above 1 sec. Some of the latest improvements involve reducing latency, in particular the overhead of query dispatch and sending back result data. The improvements are clearly visible, we were able to demonstrate 90 milisec response time for individual low-volume queries - 100x better than before.
- Work to do:
- When we run 5 full scan queries, some low volume queries get stuck, and wait to be scheduled for a long time (minutes), this needs to be optimized. But overall things balance out because full scan queries end before planned time and there is quite time, when low volume queries can catch up.
- Single-table scared scans are not working well. This will be fixed in W16
- Multi-node shared scans are not working. We did not implement it yet. The plan is to implement this in W16
- The tests revealed problem with handling large results on the master node: when a query involves multi-GB results, our master node will currently use excessive amount of memory and CPU. (Some of the tests we ran produced result sets up to 46 GB over the period of 30 hours). The uncovered issue will be addressed in FY16 (
)Jira server JIRA serverId 9da94fb6-5771-303d-a785-1b6c5ab0f2d2 key DM-3495
...
select count(*) from Source where flux_sinc between 1 and 2;
+----------------+
| SUM(QS1_COUNT) |
+----------------+
| 3539300 |
+----------------+
1 row in set (18 min 8.09 sec)
...
select count(*) from Source where flux_sinc between 2 and 3;
+----------------+
| SUM(QS1_COUNT) |
+----------------+
| 3589961 |
+----------------+
1 row in set (17 min 57.38 sec)
...