...
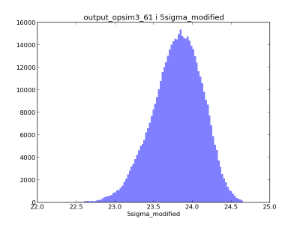
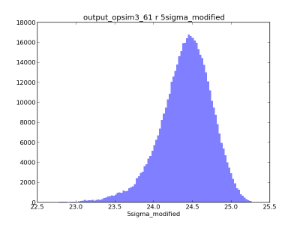
Example oneD binned metrics, the 5-sigma limiting depth distributions in r and i. The oneDBinner combined with a 'count' metric basically creates a histogram.
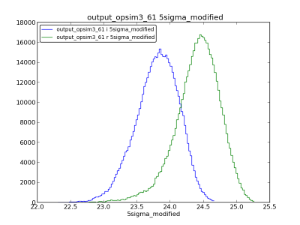
A comparison on the oneDBinner metrics from above.
The code which generates the plots above –
Examples code can be found in the git repository in the examples directory. Specifically, the test_oneDmetric.py and test_spatialmetric.py scripts calculate and plot a set of simple metrics on oneD and healpix bins. The test_oneDmetricComparison.py and test test_spatialmetricComparison.py scripts read script reads the metric results saved by the previous scripts and test_spatialmetric.py and generates comparison plots of the two sets of data (r vs i band for the global grid test, dithered vs nondithered for the spatial grid example).
Future Work
- The metrics currently implemented only require the Opsim output table. We also need to create metrics useful for engineering purposes (such as average slew time) that take data from other Opsim tables. This may require fleshing out the Database object further.
- Developing a driver script that uses pex_config to easily configure and run multiple metrics across a large number of Opsim runs.
- A visualization layer for organizing and presenting the MAF plots.