David Nidever is working on reducing the COSMOS DECam data with the stack. Starting from Community Pipeline reduced InstCal images.
I'm using my IDL workflow (https://github.com/dnidever/lsst-tools) to reduce the data. So far processCcdDecam.py is working.
July 27, 2016
I reran processCcdDecam on the COSMOS data using PSFEx. Here are the resulting photometric scatter plots.
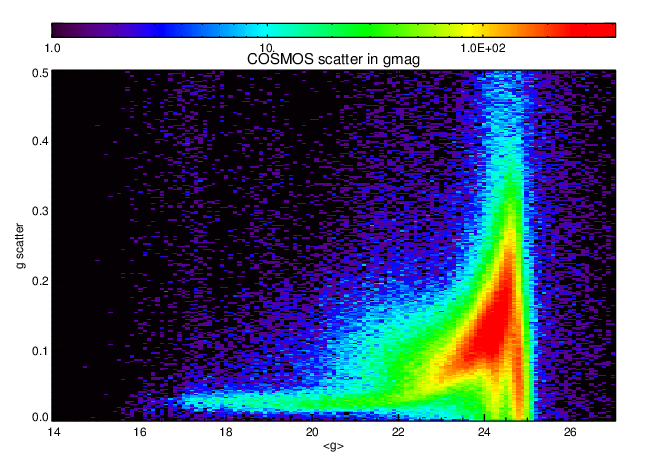
Photometric scatter per object across multiple visits (g-band)
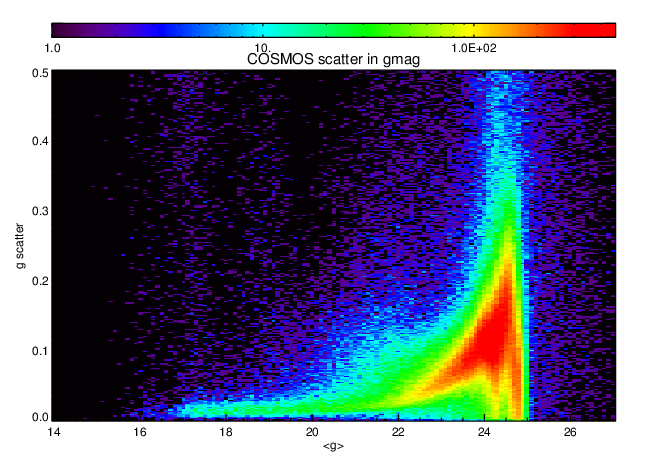
The median scatter on the bright end is ~0.014 mag. PCA gave ~0.035 mag.
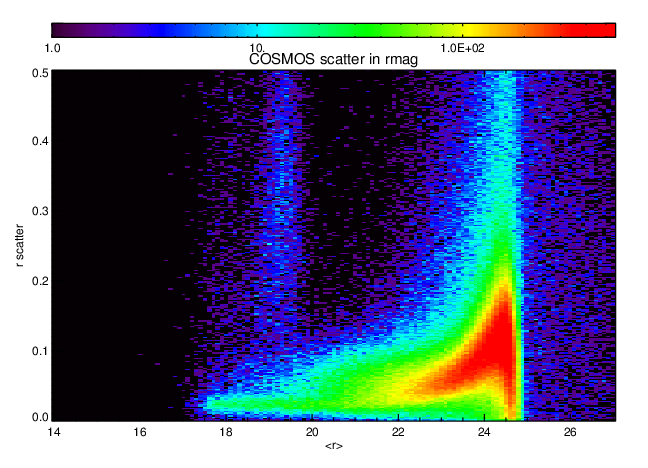
Photometric scatter per object across multiple visits (r-band)

The median scatter on the bright end is ~0.016 mag. PCA gave ~0.025 mag.
Photometric scatter per object across multiple visits (i-band)
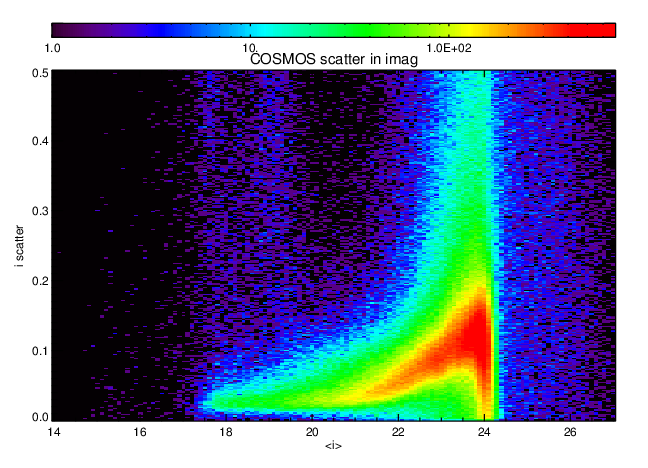
The median scatter on the bright end is ~0.024 mag. PCA gave similar values, maybe slightly worse.
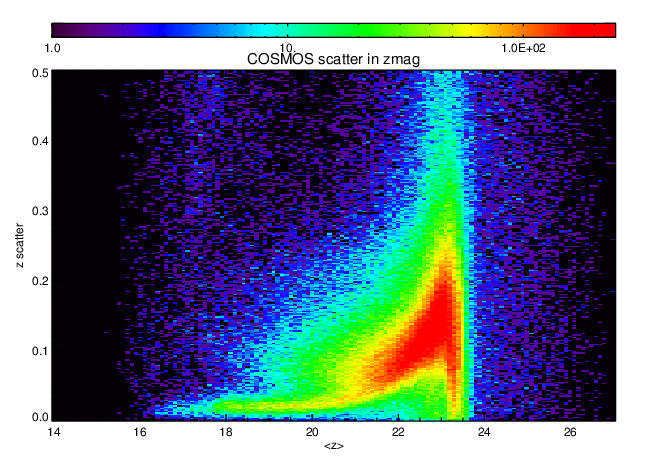
Photometric scatter per object across multiple visits (z-band)
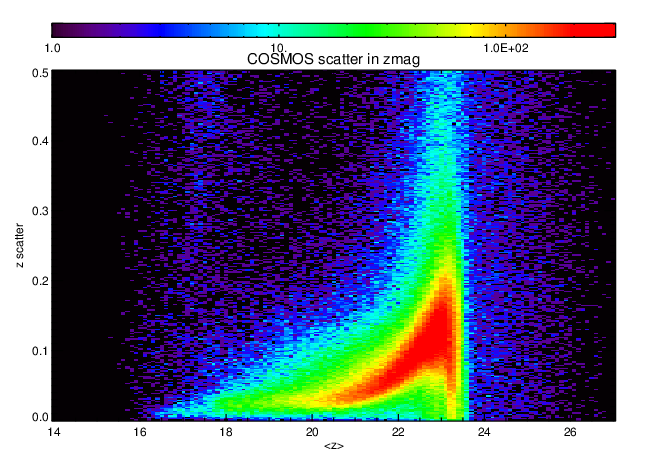
The median scatter on the bright end is ~0.022 mag. PCA gave ~0.015 mag, significantly better. BUT SEE BELOW.
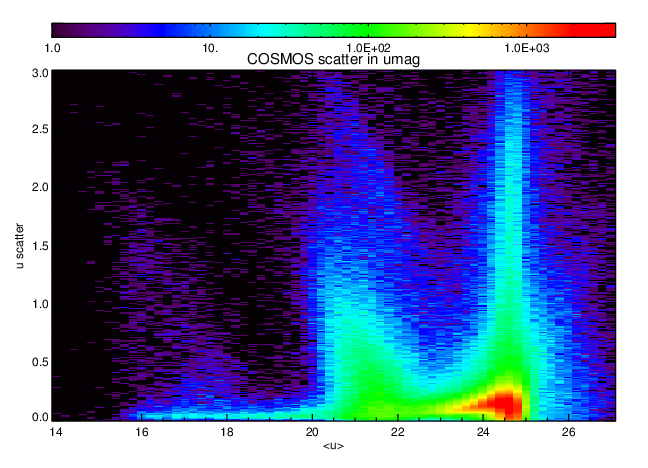
Photometric scatter per object across multiple visits (u-band)
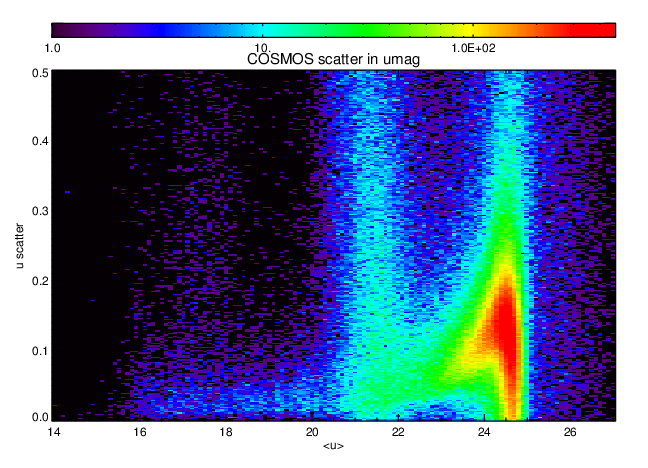
The median scatter on the bright end is ~0.026%, but a broad swath from 0.01 to 0.05 mag. PCA gave similar values, maybe slightly better.
Astrometric scatter per object across multiple visits

The median scatter on the bright, non-saturated end is ~70 mas but a wide swath from 30 to 110 mas (g=17 - 21). PCA gave similar values.
I double-checked the photometric scatter plots for the un-ubercal'ed (i.e. "raw" magnitudes) and z-band ones are VERY good for both PCA and PSFEx. For some reason my ubercal routine is having problems in the z-band. Here's the z-band scatter for PSFEx.
The median scatter on the bright end is 0.017 mag.
I double-checked the ubercaled and un-ubercaled photometric scatter plots for the other four bands and the ubercaled version is always better (especially for g-band).
In the end, it looks like PSFEx is better and sometimes as good as PCA. So I'd recommend moving over to PSFEx as the default.
June 1, 2016

This shows the photometric residuals (relative to the median for that object) as a function of where the measurements were made on the chip. There doesn't seem to be a clear spatial pattern (e.g. near the edges).
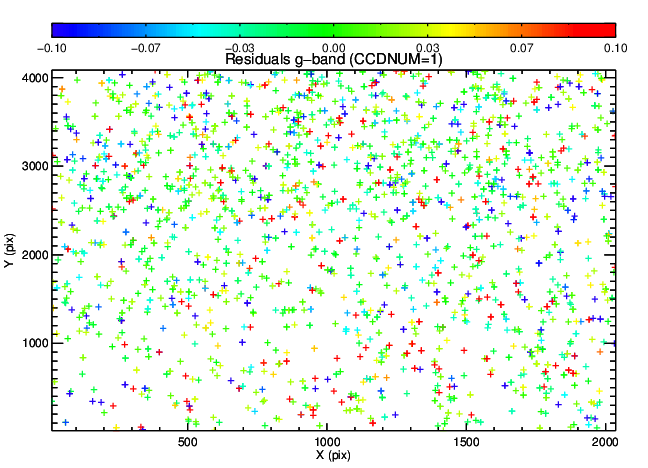
Looking at some of the individual chips also doesn't show any general trend. The discrepant values seem pretty random.
May 11, 2016
Photometric scatter per object across multiple visits (g-band)
I cleaned up the ubercal a bit and now only included the COSMOS field data (excluding standard star fields). The figure is "cleaner" but there's still a threshold at ~1.5%.
Photometric scatter per object across multiple visits using APERTURE photometry (g-band)

Here are the results from the aperture photometry (using rad=12 pixels aperture). The scatter is significantly lower at the bright end, at ~0.4% for the brightest stars, but haven't hit a lower limit. So the conclusion is that there are systematics in the PSF photometry and model as RHL suggested last week. Will rerun processCcdDecam on a lower spatial variation for the PSF to see if that improves things.
May 4, 2016
Photometric scatter per object across multiple visits (g-band)

The scatter is now down at the 1% level. But I think it should still be better. Need to double-check that there aren't any bugs my code.
Apr. 13, 2016
RMS of magzero from photcalib
processCcdDecam calibrate.photcalib prints to the log the magzero and RMS of magzero values. Here they are:
u-band, median=0.00105 mag
g-band, median=0.00046 mag
r-band, median=0.00046 mag
i-band, median=0.00055 mag
z-band, median=0.00043 mag
As you can see, these are very small and significantly lower than the scatter seen in the individual objects over multiple visits.
Relative fluxmag0 vs. ccdnum (u-band)
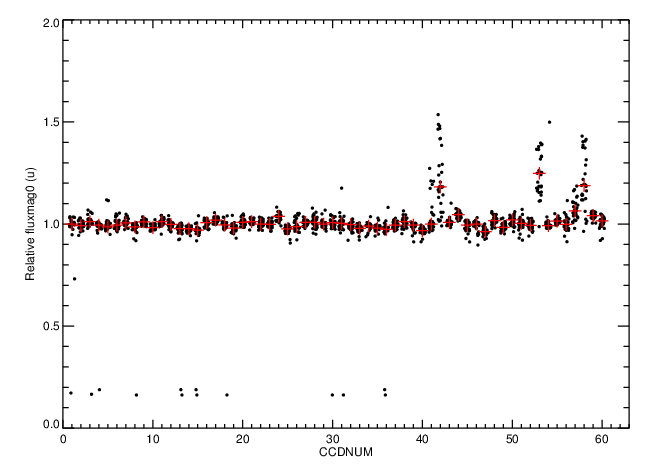

The scatter in the median values per chip is 0.0172050. The median RMS scatter within each chip is 0.0156581.
Relative fluxmag0 vs. ccdnum (g-band)


The scatter in the median values per chip is 0.0156870. The median RMS scatter within each chip is 0.0141491.
Relative fluxmag0 vs. ccdnum (r-band)
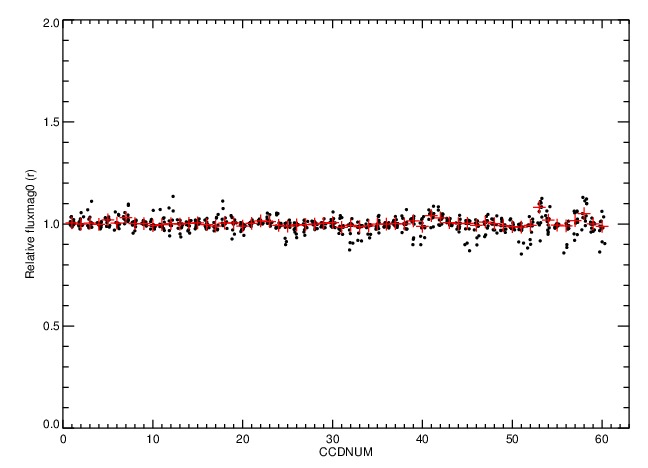
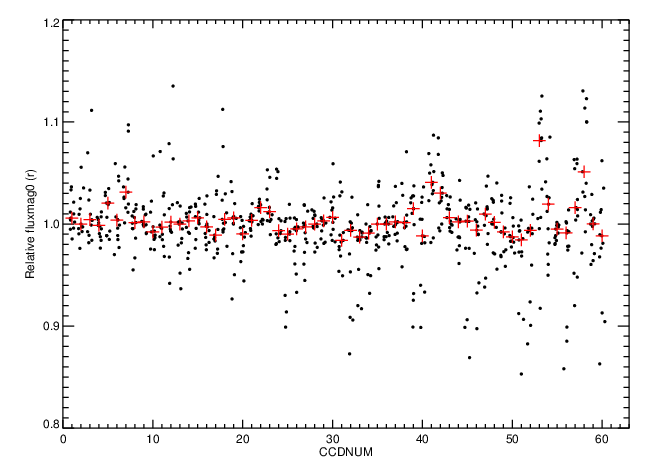
The scatter in the median values per chip is 0.00920814. The median RMS scatter within each chip is 0.0183769.
Relative fluxmag0 vs. ccdnum (i-band)
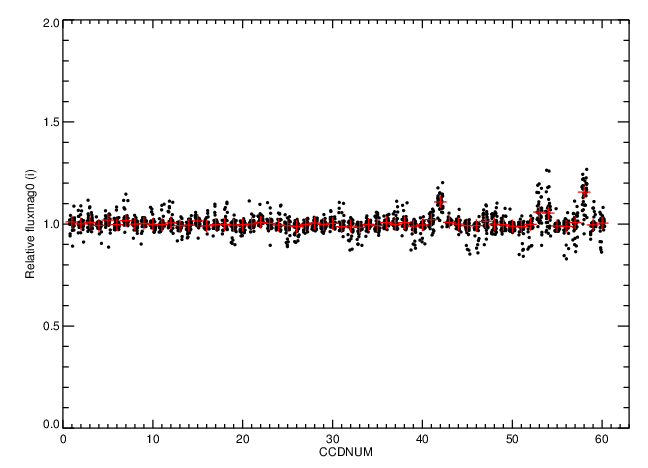
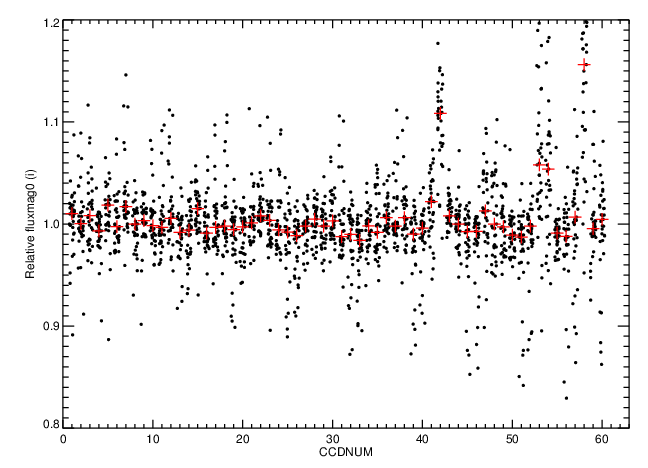
The scatter in the median values per chip is 0.00903445. The median RMS scatter within each chip is 0.0209395.
Relative fluxmag0 vs. ccdnum (z-band)
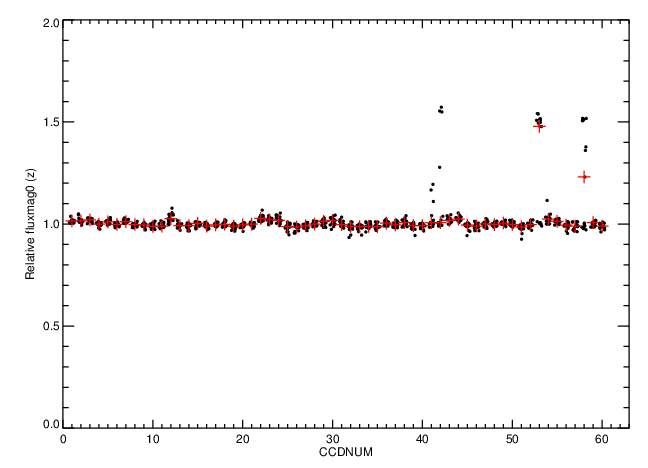

The scatter in the median values per chip is 0.0124773. The median RMS scatter within each chip is 0.0100144.
These scatter values are also smaller than the scatter in individual objects over multiple filters.
They are also smaller than the RMS of relative fluxmag0 per visit (colorful histogram from last week). We thought last week that these high RMS values were because there are REAL variations between the chips. The plots above show that is true, but the chip-to-chip variations that are relatively constant over time are not that large (~1-2%). However there are variations around those values (1-2%) and some large outliers. The large outliers make me wonder if the errors on the zero points are really as small as they are reported to be.
Apr. 6, 2016
The processing step on which the failure occurred
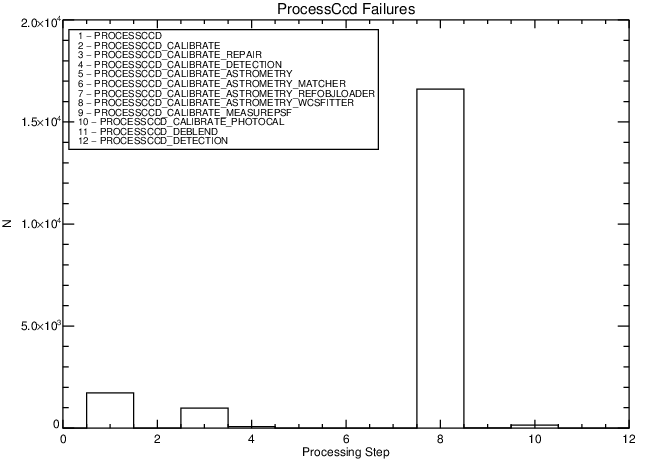
Most failures happened on the WCS fitting step.
Here's the statistics on the failed chips:
filter ntotal nfailed percfailed
u 11700 9347 80%
g 6900 5204 75%
r 2520 1352 54%
i 3720 1392 37%
z 1140 104 9%
Most of the chips that failed are short (<=10s) and half were u-band. This includes both exposures on the COSMOS field and the standard star field.
Essentially all of the failures have no icSrc file indicating that no SDSS reference objects were found in this area of the sky. There are ~10,000 calexps of standard star fields have DEC<=-30 and so are not in SDSS, a couple others should be in SDSS at DEC=0 but might only have partial coverage. So the large number of failures is probably just because of the SDSS coverage map.
99.8% of the calexps that had reference sources succeeded through processCcdDecam.
The relative RMS scatter of fluxmag0 within a visit (50+ chips succeeding per visit)
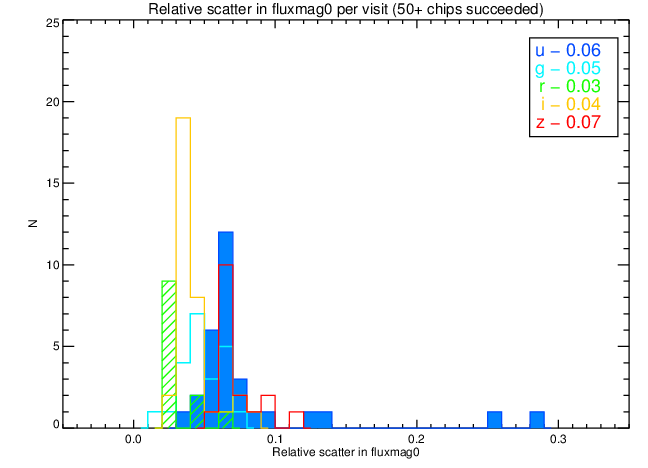
This is the same plot as before but now only including visits that had 50+ chips that succeeded. That spurious peak of u-band visits near zero is now gone, as expected.
I still find it surprising that the photometric scatter values for the individual (bright) sources are as large as they are.
Mar. 30, 2016
Summary plots from the processCcd processing results of the COSMOS data using SDSS as the reference catalog.
processCcdDecam run summary:
- 8581 succeeded
- 18381 failed
Here are the QA html pages with summary statistics and metrics. Here's a FITS file with all the metric information.
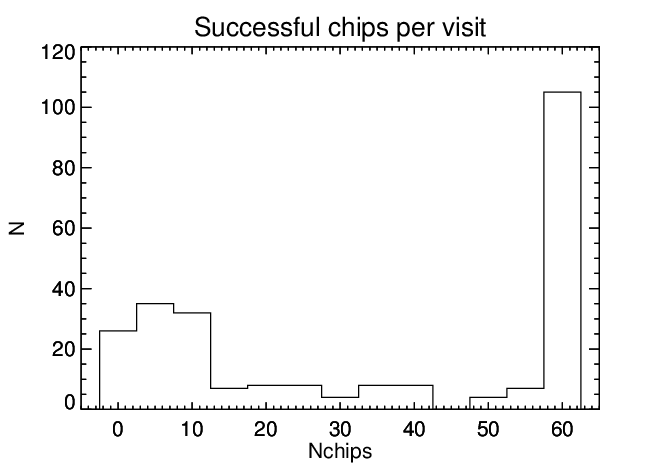
Number of chips successfully processed per visit
Photometric scatter per object across multiple visits (u-band)
The median scatter on the bright end is ~0.07 mag, but there is a "grouping" around 0.03-0.05 mag.
Photometric scatter per object across multiple visits (g-band)
The median scatter on the bright end is ~0.035 mag.
Photometric scatter per object across multiple visits (r-band)
The median scatter on the bright end is 0.02-0.03 mag.
Photometric scatter per object across multiple visits (i-band)

The median scatter on the bright end is 0.02-0.05 mag.
Photometric scatter per object across multiple visits (z-band)
The median scatter on the bright end is 0.01-0.03 mag.
The relative RMS scatter of fluxmag0 within a visit
The astrometric scatter per object across multiple visits

Color Magnitude Diagram (g vs. g-i)

Feb. 10, 2016
I'm using my IDL workflow (https://github.com/dnidever/lsst-tools) to reduce the data. So far processCcdDecam.py is working. Here are the QA output webpages (user:lsst, password:"standard" lsst one).
More summary plots from the processCcd results:
This is now showing QA metrics from the stack itself using a I wrote.
Ellipticity vs. FWHM color-coded by band
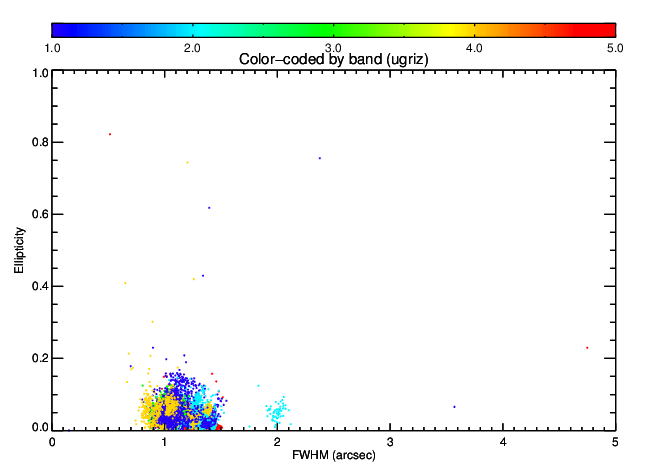
This is a similar plot to the one I made a couple weeks ago with the FWHM and ellipticity using the CP values. This new figure is showing the same thing but now with FWHM and ellipticity measured from the stack PSF for each calexp (where FWHM is 2x the average of the semi-minor and semi-major axis). These are much more reasonable numbers than the CP, especially the ellipticity values. The FWHM values actually aren't so different.
Ncosmicray pixels per second vs. FWHM color-coded by band
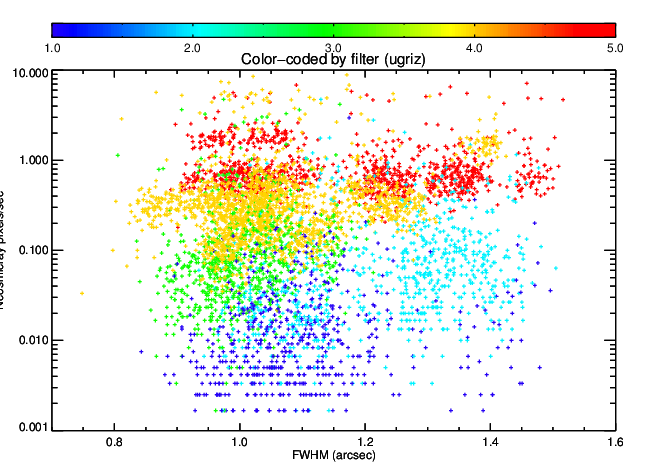
Ncosmicray pixels per second vs. sky value color-coded by band

There is a strong correlation with background value which worries me. Maybe the CR algorithm is picking up Poisson noise in the background. Let look at some images.
Image and mask showing CRs for high-CR z-band image
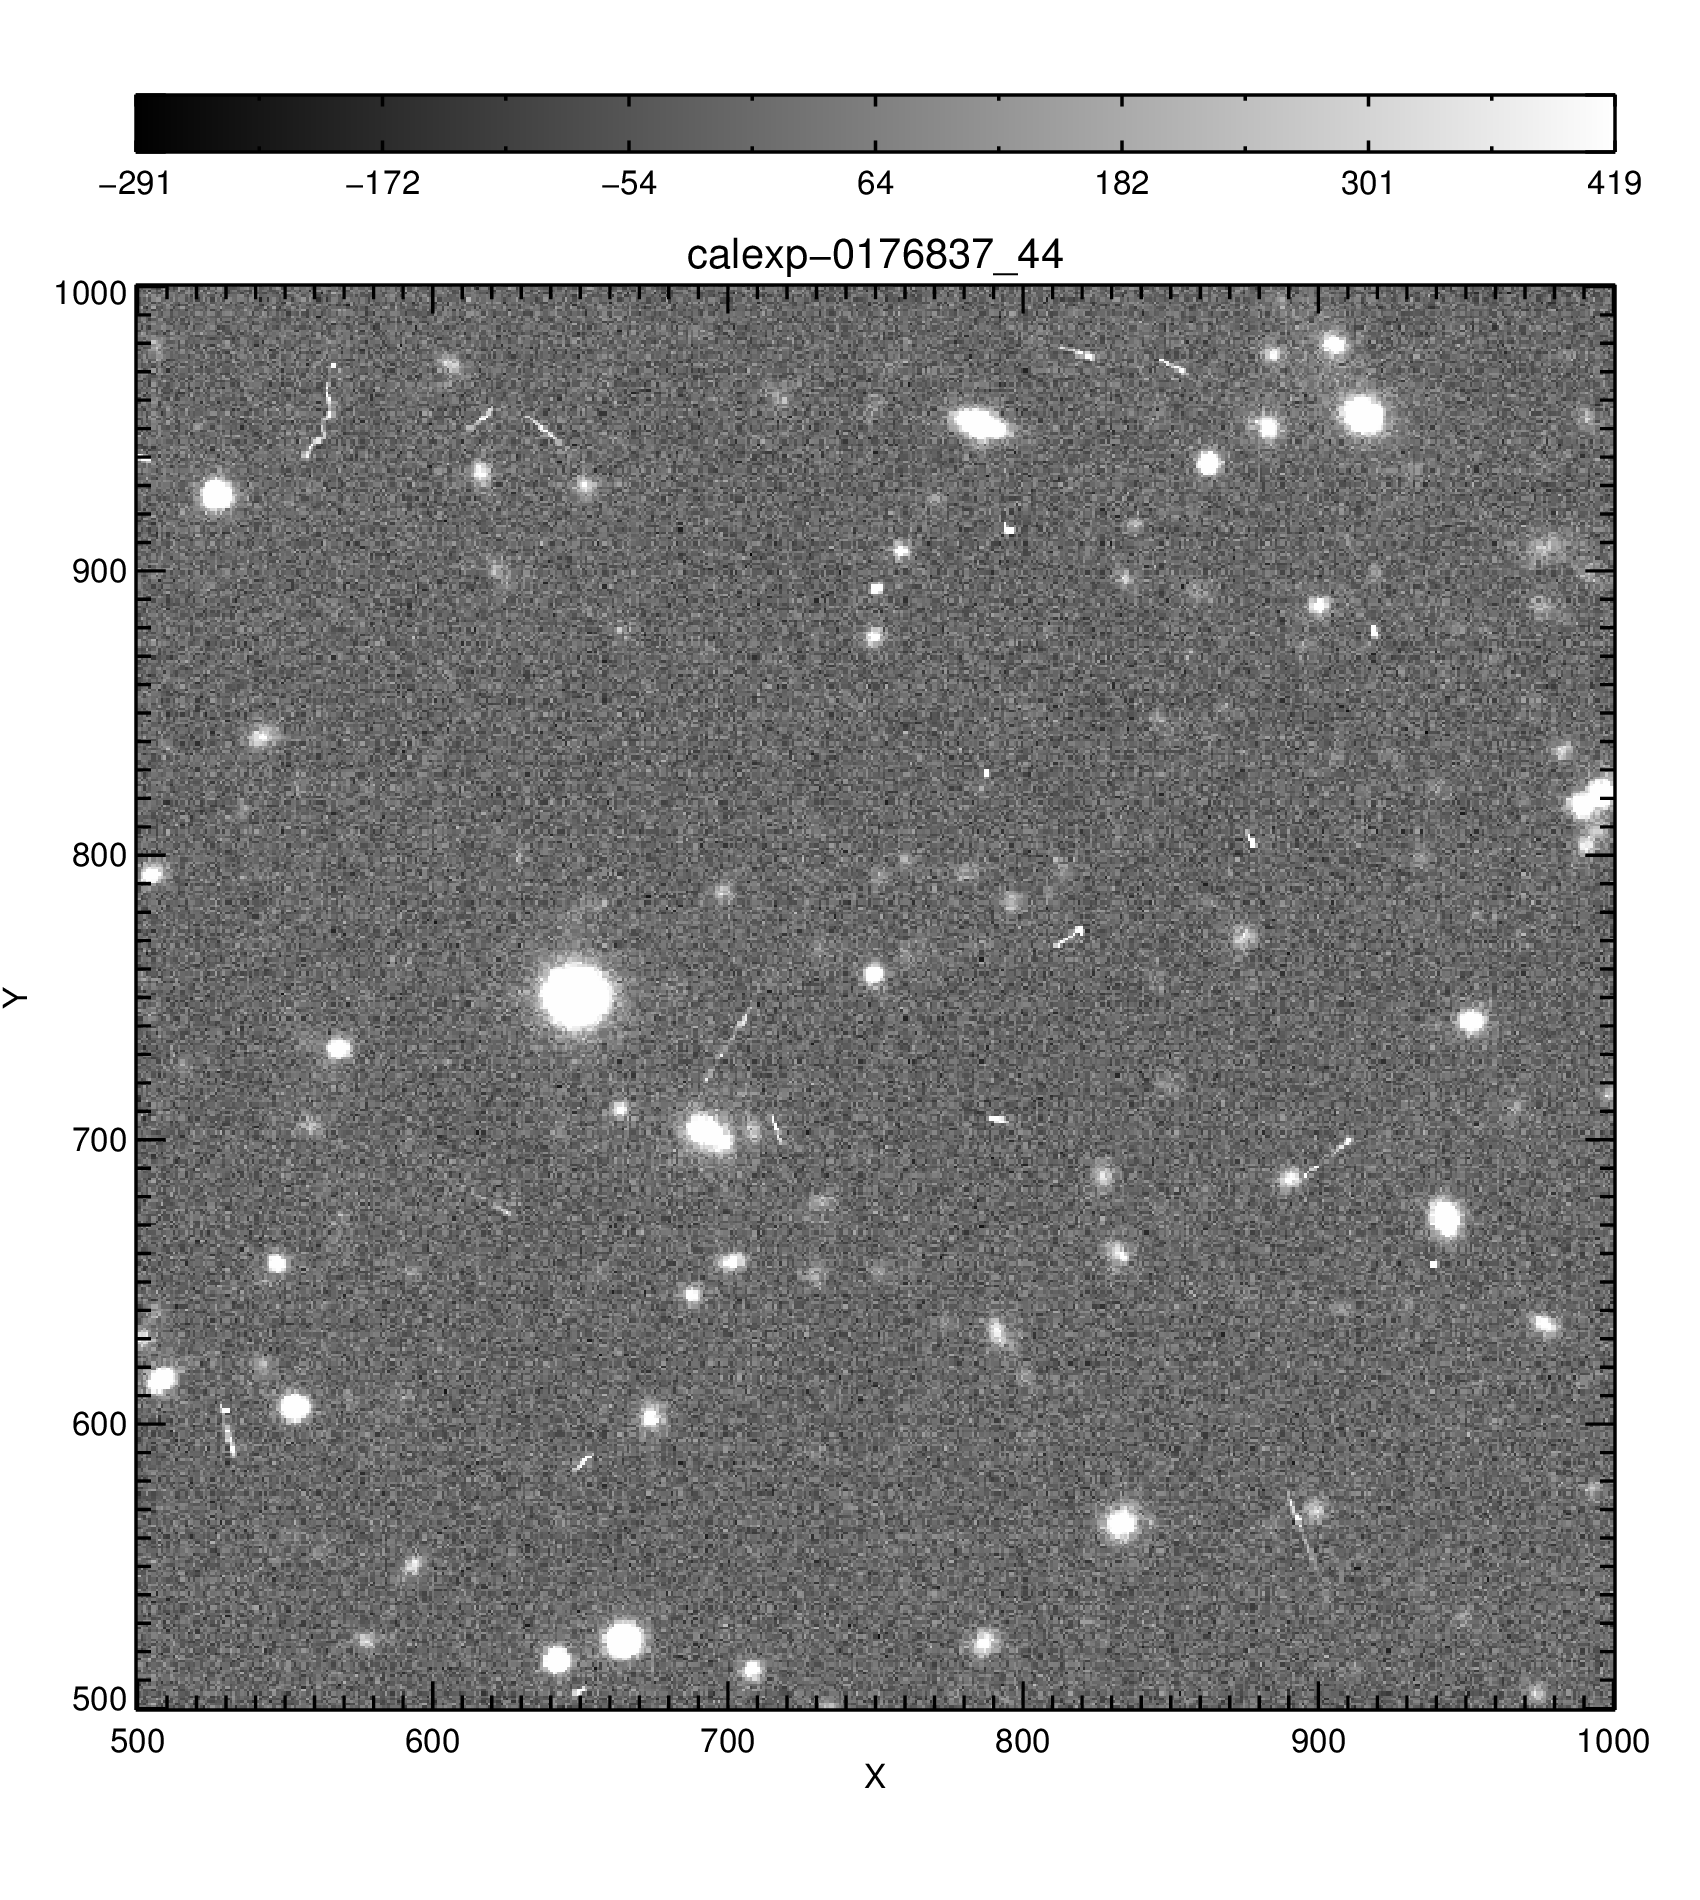

Image and mask showing CRs for medium-CR z-band image

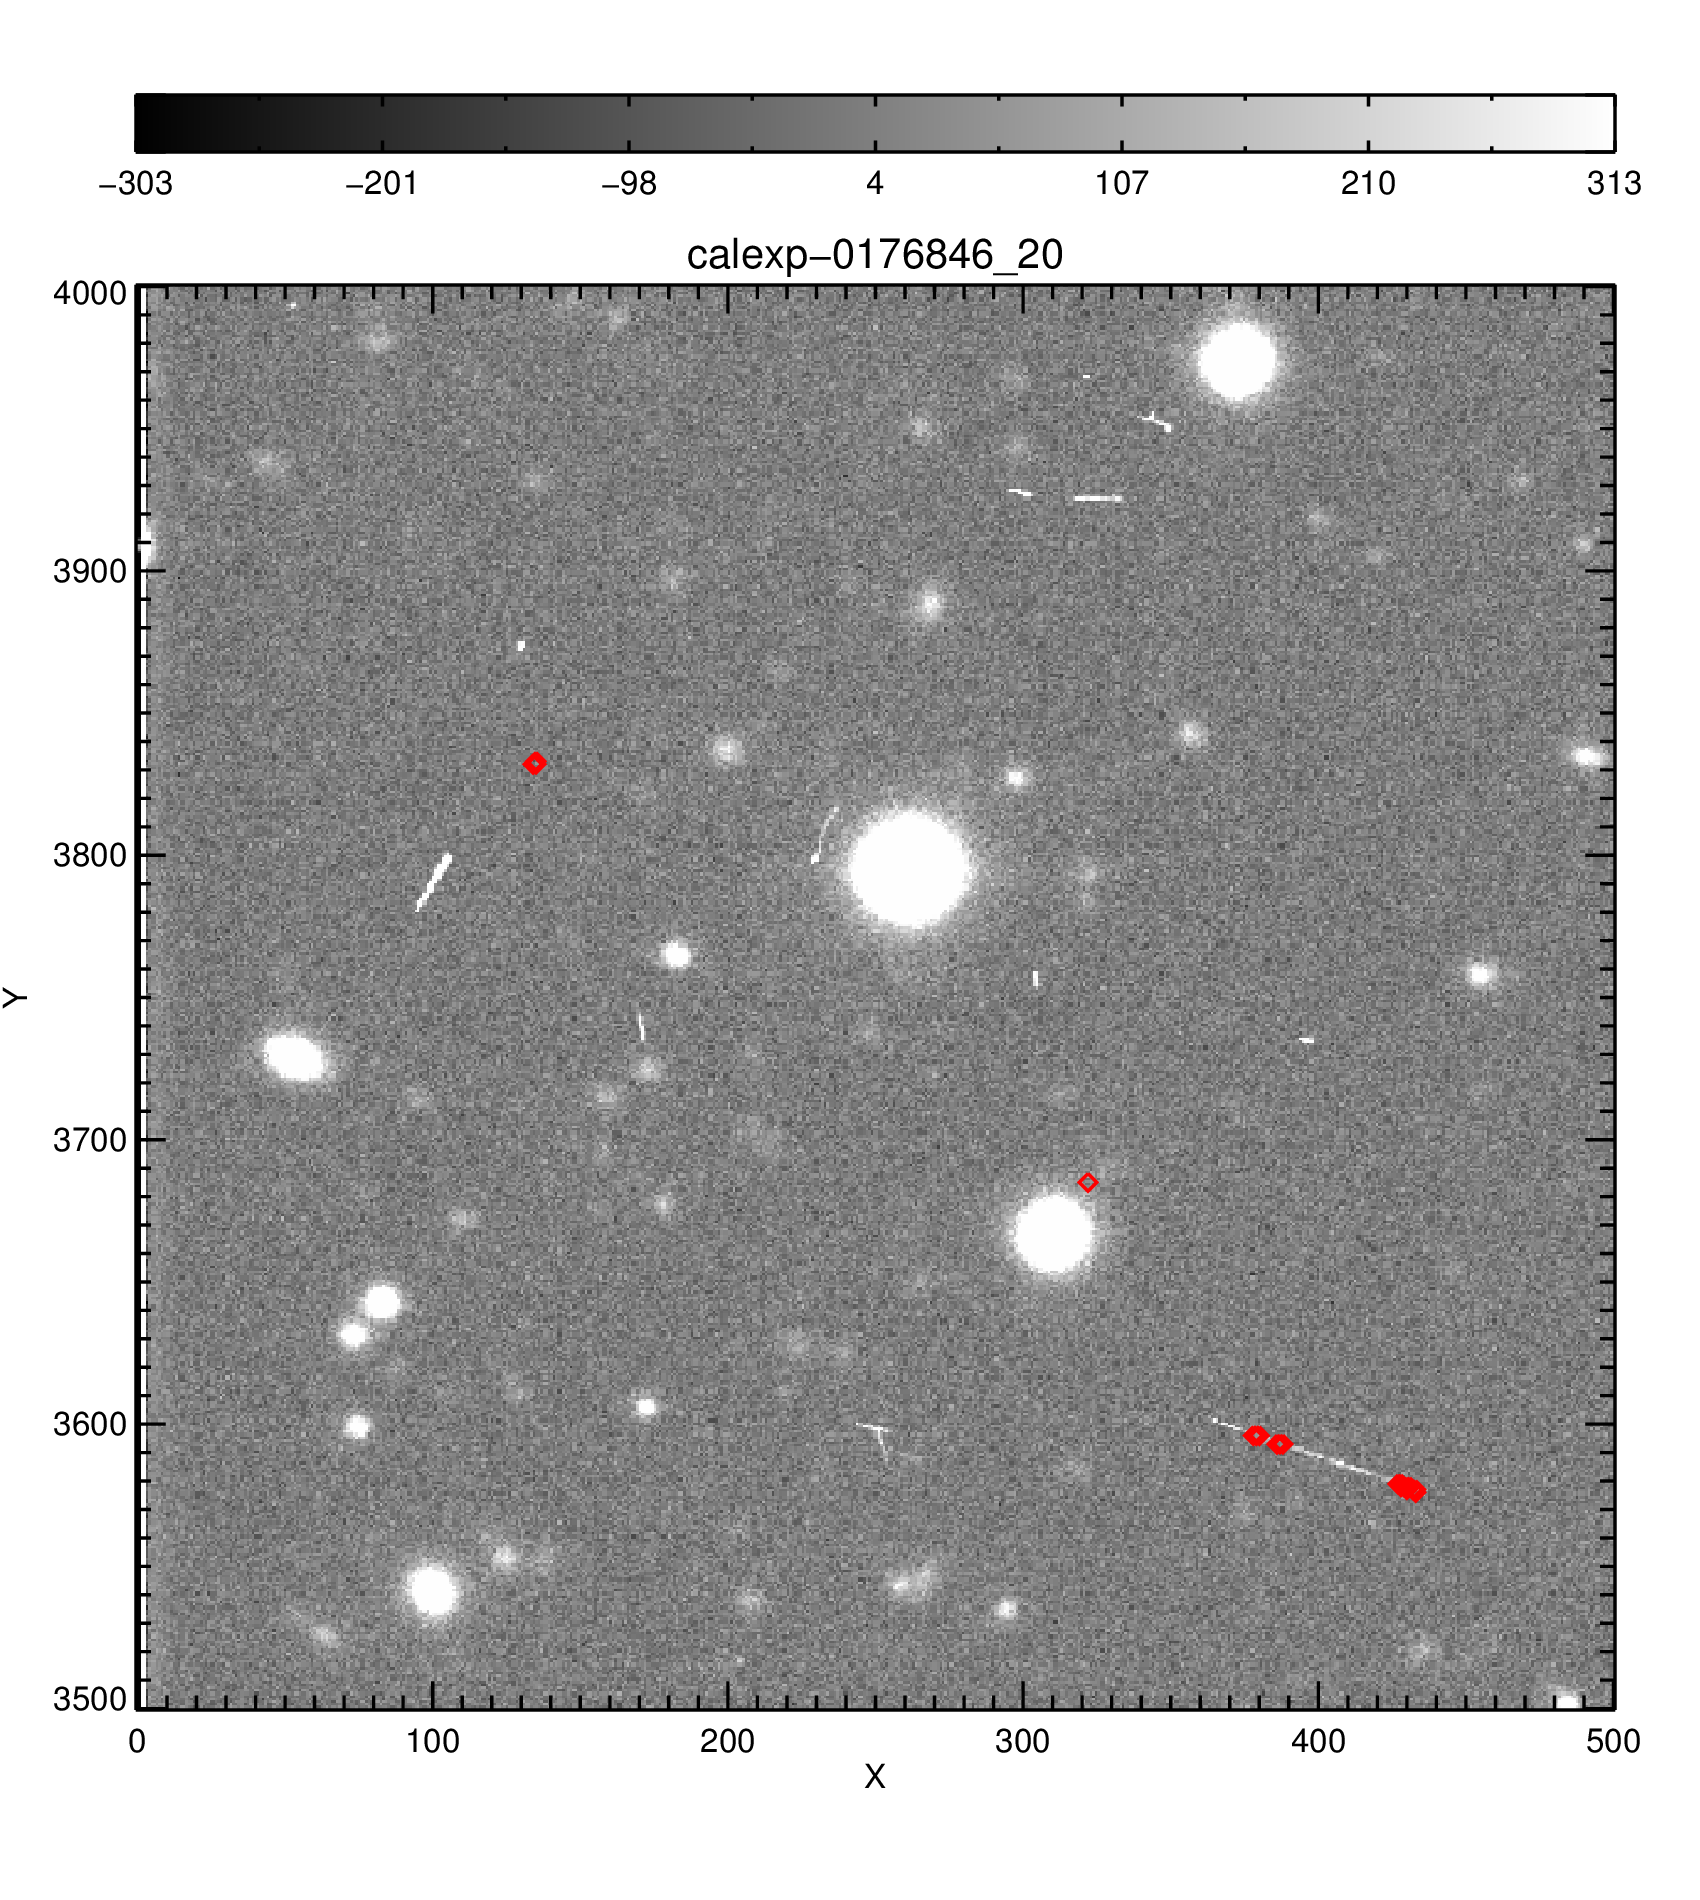
There are lots of "worm-like" CRs that are not getting picked up by the CR algorithm. It actually might be the case the CR algorithm is doing better in the high-background regime than the low-background regime.
Needs further investigation.
Jan. 27, 2016
Some summary plots from the processCcd results:
Each point represents one "calexp", so one for each chip/exposure. There are ~120 exposures, six bands, many nights.
The FITS file with the summary statistics can be grabbed here.
One difficult part about interpreting these results it separating real effects in the data from issues with the reduction.
Ellipticity vs. FWHM color-coded by band

I'm not entirely sure what to make of this, but it looks quite interesting. I don't understand why each band is getting different shapes. It turns out both "FWHM" and "ellipticity" come from the CP and therefore have nothing to do with the stack. I still find this interesting.
Delta FWHM vs. CCDNUM color-coded by band
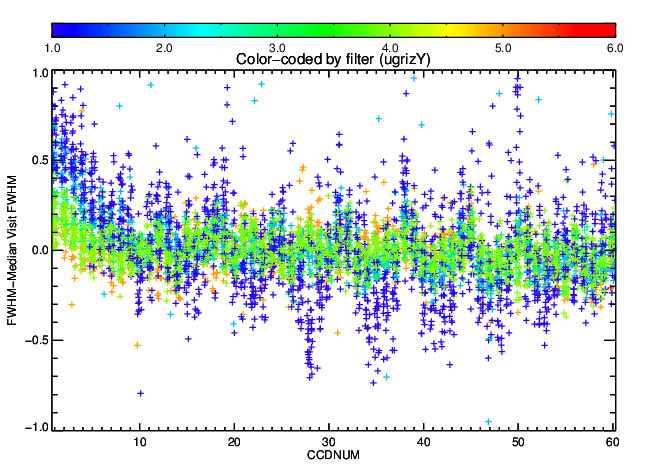
The structure intrigued me so I made more plots below.
Delta FWHM vs. RA color-coded by band
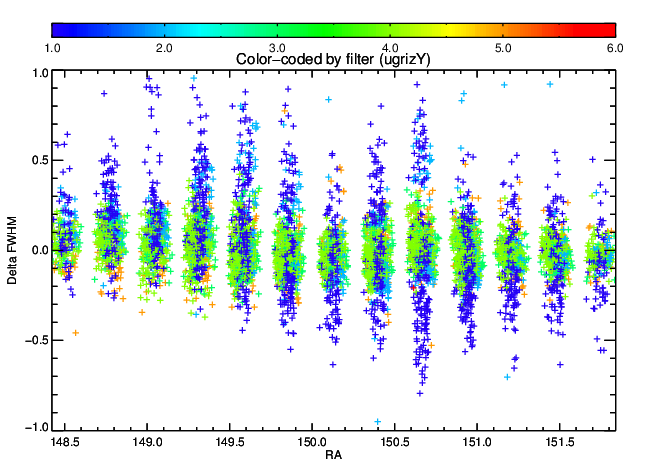
Not super enlightening.
Delta FWHM vs. DEC color-coded by band

This is very intriguing. My guess is that this is a real effect, probably from the optics, and not something from the reduction.
Ncosmicrays vs. CCDNUM color-coded by band

It's not clear to me why the number of cosmic rays should depend on the filter. Maybe it's more a function of the background value. Maybe many of the "CRs" detected in the redder bands are actually just noise spikes.
Ncosmicrays vs. FWHM color-coded by band

While there is a weak (inverse) dependence on FWHM, the # of CRs still depends mostly on the filter.
WCS RMS vs. CCDNUM color-coded by band
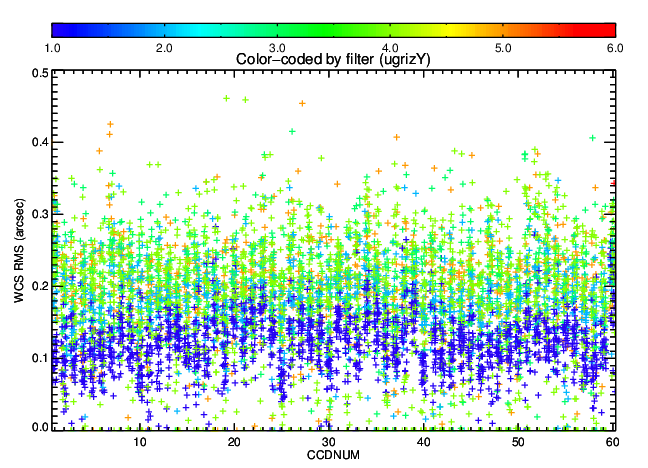
The dependence on band is somewhat suspicious. The bands with higher RMS also have more detected sources (see next plot). I would think that their astrometric solutions would be better constrained, but that's not what the "RMS" value is really measuring. It's measuring the scatter around the best-fit solution and if there are more points then there is more chance for outliers. So maybe that's all that's happening here. In that case, maybe we just need to use a robust RMS.
Ndetected vs. CCDNUM color-coded by band

Nothing unusual here.
Ndeblended vs. CCDNUM color-coded by band
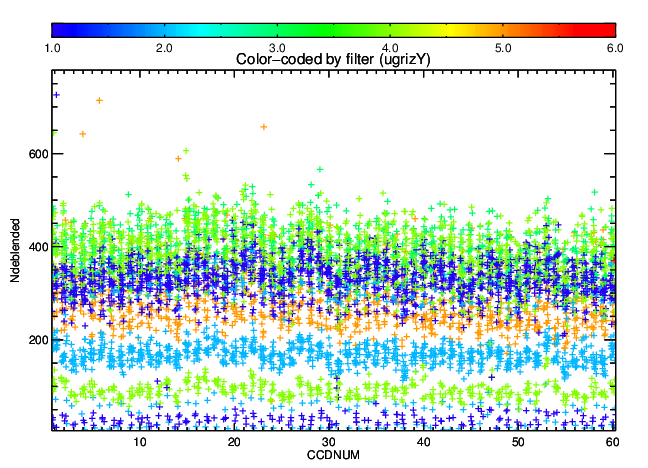
This is also expected and mostly matches the Ndetected trends above.
Hess diagram using average g and i magnitudes for all sources
This CMD doesn't look that great.
Photometric scatter across multiple g-band observations
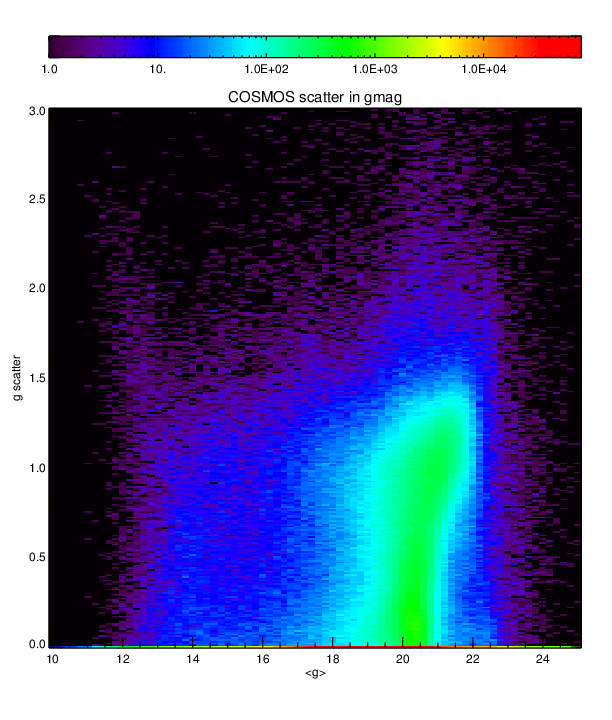
I was very surprised when I saw this. The scatter should be small and rising with magnitude. These values are ~1.
I dug into the individual values in the catalogs and it turns out that the flux calibration is not very good.
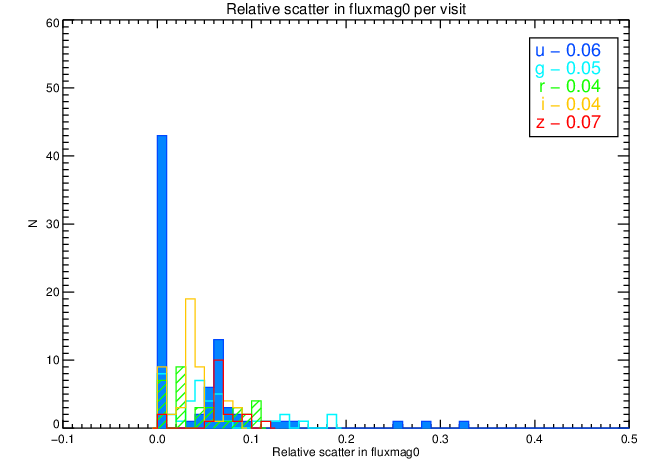
The relative scatter in fluxmag0 within each visit
One of the issues that I found with the flux calibration is that only is it inconsistent across multiple observations of the same field with the same filter, but it's even inconsistent across different chips from the same visit. This is the distribution of relative scatter in fluxmag0 (relative to the median across all chips) for all the visits broken down by filter (median values are in the legend). The scatter is very large for the blue filters but it gets progressively better for the red filters. This isn't too surprising since I'm using 2MASS J-band as the reference catalog. However, even if the flux calibration was "bad" I would expect it to stay consistently "bad" across the chips.
My guess is that the flux calibration is important for coaddition, but I'm not entirely sure. How do we get a good flux calibration for a multi-band dataset like COSMOS without a good multi-band reference catalog?
2 Comments
Anonymous
Geçici Dövme
Geçici Dövme Satın Al
Geçici Dövme Modelleri
Dövme Modelleri
Dövme
Anonymous