Clouds
 ctio_cloud_oct2017.mp4 October 2017 1st-20th
Ozone 2010-2018


PWV, last 8 years


- On an annual basis, looking at 8 years of data, Ozone and PWV are anti-correlated
Aerosol Optical Depth
AOD from Oct. 1st to 20th, 3hour steps.
The AOD above CTIO varies between 0.01 and .10 from within a few hours time scale.
The Cordillera is a north-south axis of lower AOD with respect to the ocean on the west, and Argentina on the East.
Ozone
From watching the Ozone movie :
- Level is always higher in the south
- Changes usually come from a steady direction during several days (west, south and north mostly)
West during nights 16 17 18 19
stable map night 10, 11, 12
- Gradient around 50 dobsons on a 200km square,
Usually few tens of dobsons variation with hour time.
PWV
From watching the PWV movie:
- Clean North-South axis above CTIO with low PWV
- High level (>20 often coming from the west, stopping next to CTIO)
PWV varies by ~10mm in 1 degree of longitude (~100km)
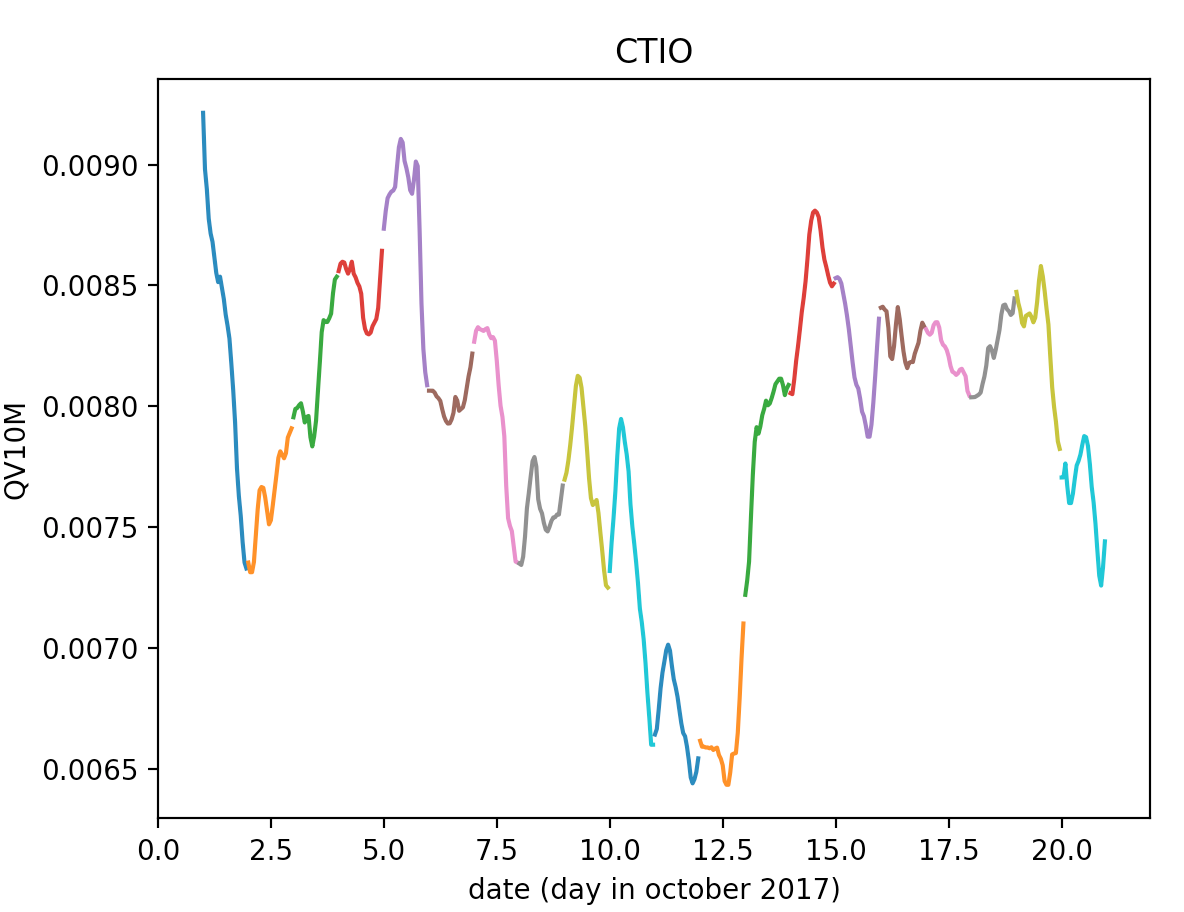
Interpolating PWV above CTIO Oct. 1st to Oct 20th 2017
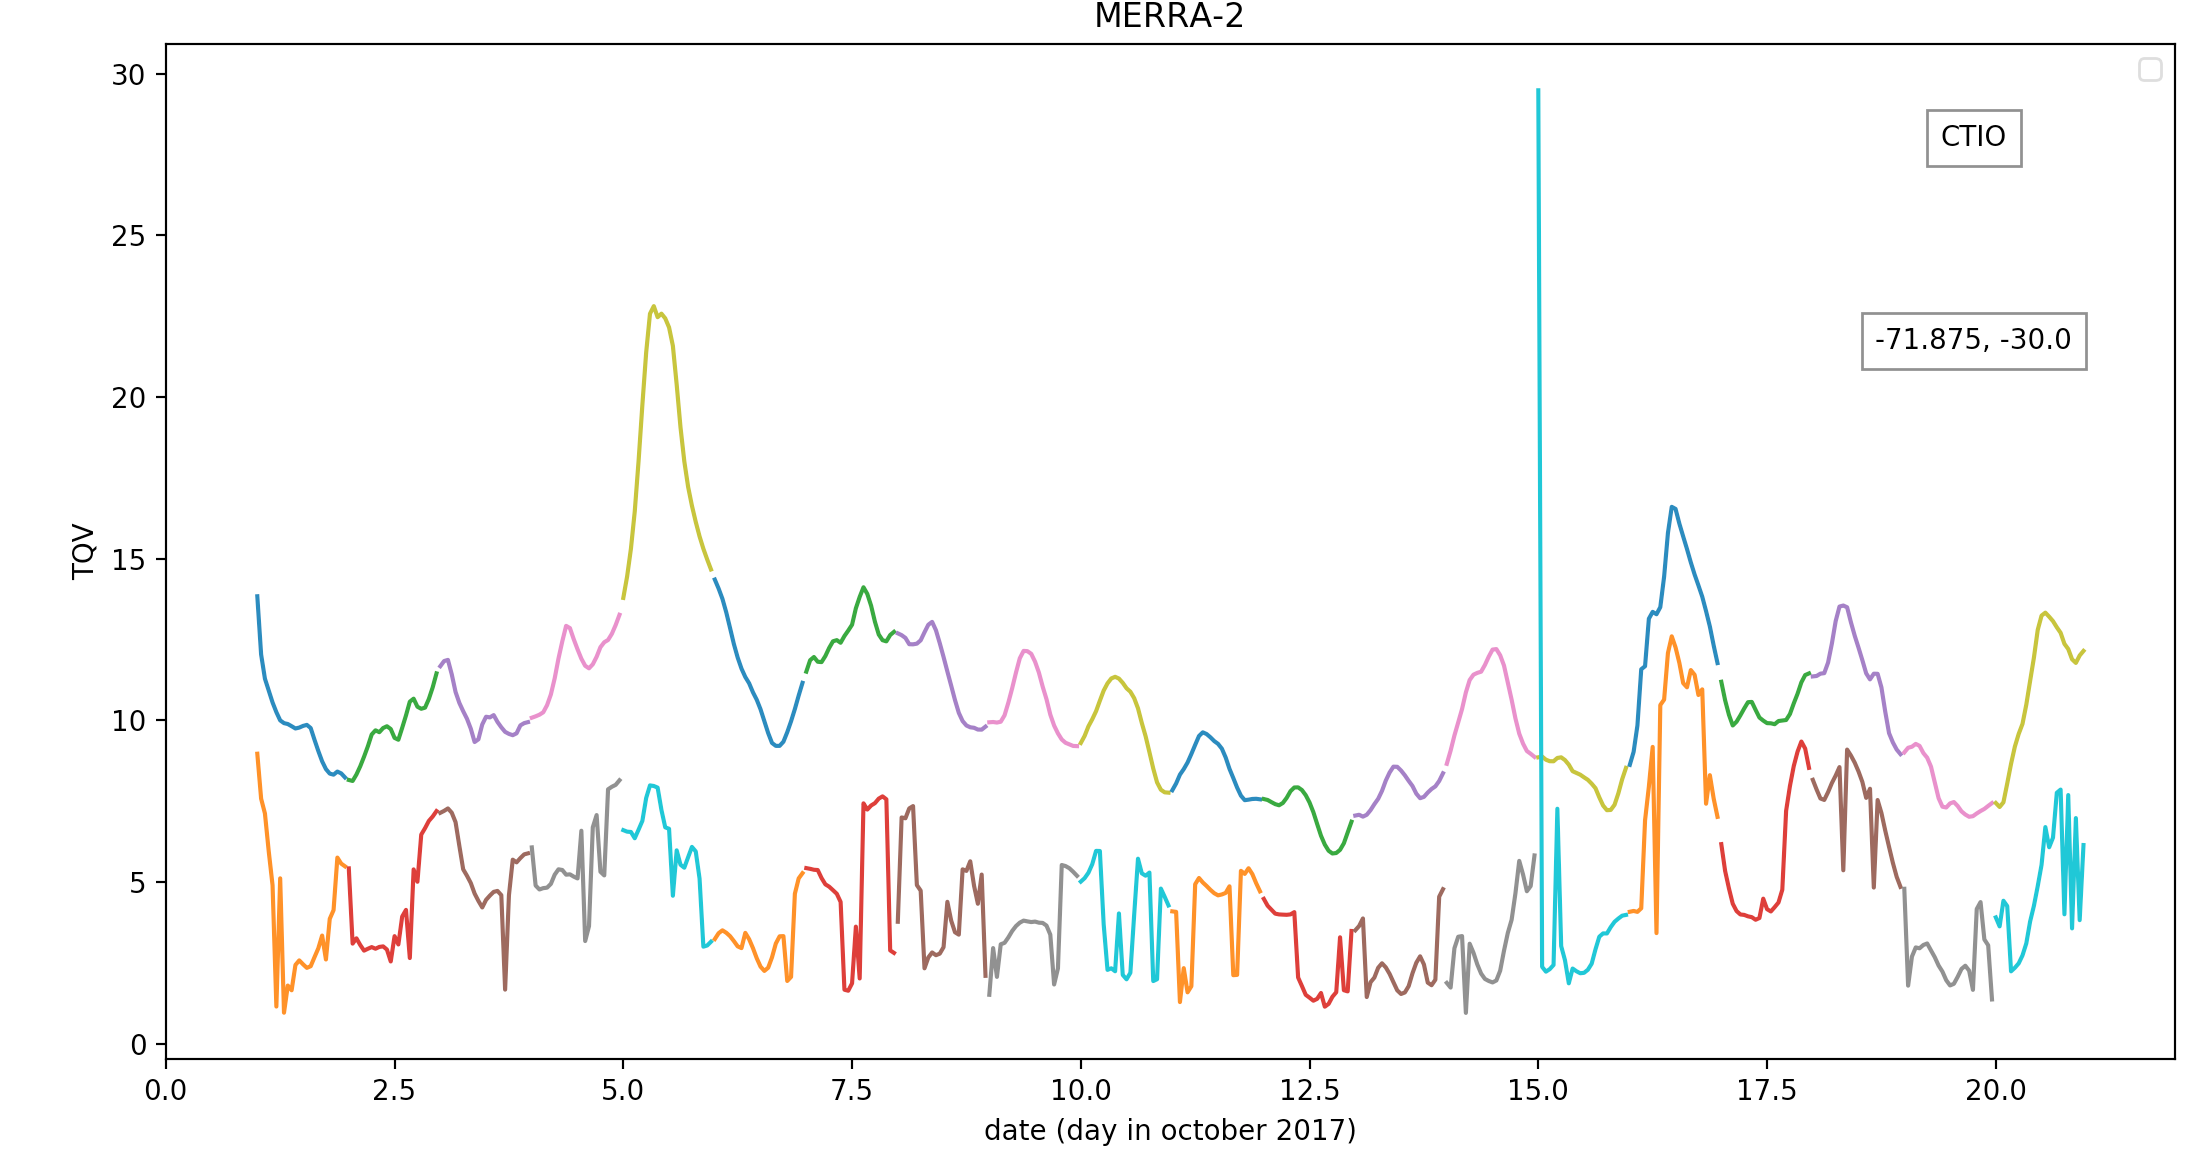
The variation can be high within a few hours time scale.
The interpolation is chopped because their are not enough node on the grid. This might be improved with using point from a larger map.
PWV Vs O3
Higher level of PWV corresponds to low O3 levels.

Investigating for priors on a grey term...
Ice Water

10 meter specific Humidity
Precipitable liquid vapor
